


 Follow us
Bengaluru second ranked in most congested cities in the world
India has two cities – Bengaluru and Pune – in the Top 10 cities where drivers spend the most time sitting in their cars. Motorists in London experience the worst congestion in the world – travelling at an average of just 14 kph during rush-hour.
 7822 Views


The most congested cities in the world have been revealed with some drivers spending almost half an hour to travel just 10 kilometres. Car rental experts at StressFreeCarRental.com have crunched the numbers to find the drivers who are spending the most time sitting in their cars.
The data reveals that motorists in London experience the worst congestion in the world – travelling at an average of just 14 kph during rush hour. Their counterparts in Bengaluru, India, experience the second worst congestion in the world, driving at an average speed of 18kph at peak periods. Two other Indian cities – New Delhi (34th) and Mumbai (47th) also figure in the list of 390 global cities.
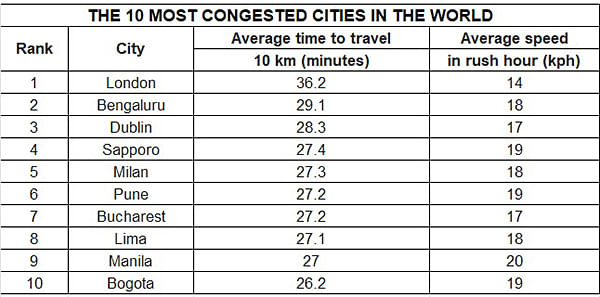
Sapporo, Japan and Milan in Italy both make the top five of the heaviest traffic jams, taking over 27 minutes to drive just 10 kilometres. Drivers in Peru and the Philippines also experience long wait times sitting in traffic, as Lima and Manila also make the global top 10 list.
Pune, India and Bucharest, Romania rank at the sixth and seventh worst congested cities in the world, taking an average of 27.2 minutes to drive 10 kilometres in each country.
Dublin, Ireland and Bogota, Colombia have some of the busiest roads in the world, with an average speed of 17 kph and 19 kph respectively, during rush hour.
A spokesperson for StressFreeCarRental.com said: “It’s unsurprising to see London at the top of the league table – living in one of the most populated cities in the world means that you’ll be driving at an average of just 14 kilometres an hour at rush hour. Of the top 10, it’s only drivers in Bogota, Colombia who can make a 10 kilometre journey in less than 27 minutes.”
The spokesperson added, “Drivers are experiencing slow moving traffic every day, with an average speed of only 17.9 kph during rush hour across the globe. And many motorists are spending close to an hour doing their daily commute because of how congested all city roads have become. This is frustratingly slow and none of us particularly enjoy spending longer than we already do sitting in our cars while we miss out on things we would rather be doing. But it is surprising not to see some of the world's biggest cities on the list – Milan ranking above New York is surprising when you consider the population and congestion reputation in the city.”
“What we might be seeing is the result of differing levels of investment into improving roads and public transport from city to city. As we try to meet targets on pollution and emissions, leaders across the world need to invest more time and money into helping the traffic flow more freely. This might involve bringing in more congestion charges for motorists, pumping more funding into improving roads as well as public transport systems, to tackle congestion across the globe.”
Study of travel times in 390 cities across 56 countries
The findings reference the TomTom Traffic Index for CY2022 which covers 390 cities across 56 countries on six continents and ranks cities around the world by their average travel times in petrol, diesel or BEV cars, and provides free access to city-by-city information.
The TomTom Traffic Index is based on floating car data (FCD). TomTom collects this data from a variety of different sources to create traffic services for its clients and customers. In the Traffic Index, we use a representative sample of this data, spanning 543 billion km, to assess and show how traffic has evolved in cities around the globe over the course of 2022.
This year TomTom introduced a new metric: travel time, through which we ranked cities by the average time it took to drive 10 km within them.
The travel time in different cities is a result of multiple factors, which can be grouped into a) quasi static factors (e.g., road infrastructure, such as street categories, capacities, and speed limits); and b) dynamic factors (e.g., traffic congestion and changes in flow). The static factors determine the optimal travel time in a city, whereas the dynamic factors provide the traffic flow changes – and the sum of both give the travel time.

RELATED ARTICLES

Horse Powertrain develops ‘all-in-one’ powertrain for hybridizing BEV platforms
 Ajit Dalvi
 20 Apr 2026
X-Range C15 Direct Drive is an ‘all-in-one’ hybrid powertrain that allows BEV platforms to serve as foundations for HEVs...

Autoliv Plans JV for Advanced Safety Electronics With China’s HSAE
Ajit Dalvi
11 Oct 2025
The new joint venture, which is to be located strategically near Shanghai and close to several existing Autoliv sites in...

JLR to Restart Production Over a Month After September Hacking
Ajit Dalvi
07 Oct 2025
Manufacturing operations at the Tata Group-owned British luxury car and SUV manufacturer were shut down following a cybe...

