


 Follow us
Mumbai worst among 100 cities worldwide for driving: Study
Comprehensive study by PSA Group company reveals the best and worst cities for driving across the globe, according to in-depth data about infrastructure, safety, costs and driver behaviour.
 14621 Views


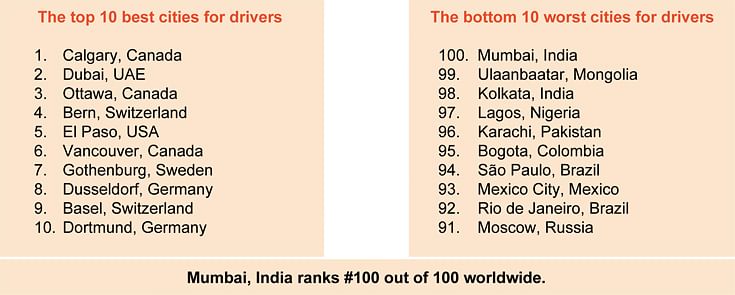
If you're fond of driving, then the financial capital of India should be the last place to indulge in your passion. European car parts retailer Mister Auto, which is part of the PSA Group, has released a comprehensive study, which reveals the best and worst cities to drive worldwide. The study, which surveyed 100 cities globally, sees Calgary, Canada, as the best city for driving due to low congestion, fatalities and affordability, while Mumbai, India, is the worst, scoring low in these factors and ranked 100 out of 100 worldwide.
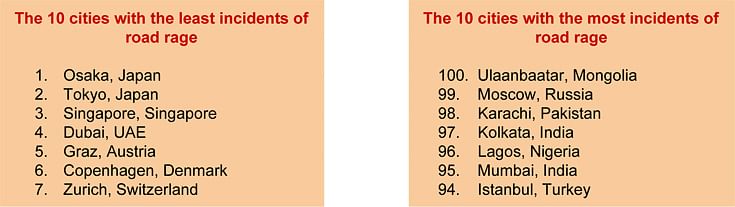
Survey results show that drivers in Ulaanbaatar, Mongolia experience the most incidents of road rage, while drivers in Osaka, Japan experience the least. Oslo, Norway, has the most expensive petrol at 1.70 euros per litre (Rs 135), while Lagos, Nigeria, has the cheapest at 36c per litre. These, and more, are the very interesting findings of this new study.
Considering that drivers spend an average of two years of their lives in total behind the wheel, the vehicle parts specialist decided to take a deeper look into the numerous elements that impact the driving experience. In fact, the company says that drivers lose over 200 hours a year commuting in the US alone. From infrastructure and congestion, to associated driving costs and driver behaviour itself, the result is a comprehensive study that reveals the cities which are successfully utilising infrastructure and legislation to improve driving conditions for their citizens.

How the study was conducted
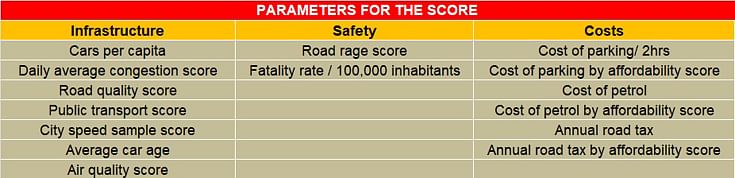
To initiate the study, data was collected from hundreds of cities worldwide, and then narrowed down to a shortlist of 100 cities. Each of these provided reliable and extensive data that allowed for a wide range of scores, from excellent to underperforming, with regards to their achievement in each factor. This ensured a range of results, allowing cities to stand out for their individual merits in comparison to other locations. It was then decided to divide the parameters of the study into three categories that are most important to making a city a good location to drive: infrastructure, safety and costs.
Furthermore, to determine a city’s infrastructure, a number of factors were examined, such as the number of cars per capita, traffic congestion, road and public transport quality, among others. Air quality levels were also investigated in order to determine the city's commitment to providing fresh air and good visibility for its drivers and citizens alike.
In addition, the safety of each location was analysed using the car accident fatality rate as well as the results of a survey focusing on incidents of road rage, in order to paint a picture of the aggressiveness and general driving culture brought to the city by its motorists.
Finally, the costs associated with driving in each city were evaluated, including not only the price of combustibles and annual road tax paid in each location, but also the purchase parity of each country to determine how affordable driving was for its inhabitants. The final index combines a total of 15 factors to reveal the best and worst cities for car owners to drive-in across the globe.
Kolkata and Mumbai rank lower than Lagos
A quick glance at 2019 Driving Index's scoreboard shows that among the combined score using the 15 parameters covering infrastructure, safety and costs used by the study (https://www.mister-auto.co.uk/driving-cities-index-usd/), Mumbai is at the bottom of the chart with a pitiable score of 1.00, while Calgary (Canada) aced the table with 100 points. Kolkata (rank 98) with a score of 29.99 is just above Ulaanbaatar in Mongolia, which managed a score of 20.30. Among the various parameters where Mumbai lost points are: least affordable city in terms of petrol price and annual road tax, high fatality rate per 100,000 inhabitants, cities with worst congestion, city speed sample score and high average car age.
KEY FINDINGS OF THE STUDY:
Costs
- The most expensive cities for parking / 2 hours are Sydney ($39.23), followed by New York ($38.54) and Brisbane ($30.87), while the least expensive cities are Mumbai ($0.45), followed by Kolkata ($0.61) and Lagos ($0.63).
- The most affordable cities for parking are Singapore (100), followed by Oslo and Bern (98.32), while the least affordable cities are Ulaanbaatar (1.00), followed by Sydney (50.66) and New York (55.53).
- The cities with the most expensive petrol price / L are Oslo ($1.91), followed by Utrecht and Rotterdam ($1.83), while the cities with the least expensive prices are Lagos ($0.40), followed by Dubai ($0.59) and San Antonio ($0.64).
- The cities with the most affordable petrol are Boston (100), followed by Dubai (99.89), and San Antonio (99.7), while the least affordable cities are Ulaanbaatar (1.00), followed by Kolkata and Mumbai (9.18).
- The cities with the most expensive annual road tax are Copenhagen ($2,370.62), followed by Rotterdam ($578.33) and Melbourne ($574.59), while the least expensive cities are Lagos ($13.99), followed by Ulaanbaatar ($14.34) and Karachi ($24.12).
- The cities with the most affordable annual road tax are Miami and Orlando (100), followed by Philadelphia (99.86), while the least affordable cities are Copenhagen (1.00), followed by Mumbai (39.12) and Sao Paulo (49.87).
Safety
- The cities with the most incidents of road rage (score) are Ulaanbaatar (99.12), followed by Moscow (98.46), and Karachi (98.13), while the cities with the least amount of road rage incidents are Osaka (1.00), followed by Tokyo (2.54), and Singapore (2.65).
- The cities with the highest fatality rate / 100,000 inhabitants are Lagos (26.20), followed by Orlando (23.40), and Mumbai (22.6), while the cities with the lowest rate are Manchester (0.80), followed by (0.90), and Oslo (1.00).
Infrastructure
- The cities with the highest air quality score are Brisbane (100), followed by Salvador (99.53) and Stockholm (98.55), while the cities with the lowest are Lagos (1.00), followed by Karachi (25.09) and Beijing (26.05).
- The cities with the most cars per capita are Athens (0.77), followed by Seattle (0.68), and Turin (0.67), while the cities with the least are Karachi and Kolkata (0.05), followed by Tel Aviv (0.07).
- The cities with the best daily average congestion score are Malmo and El Paso (100), followed by Detroit (99.54), while the cities with the worst congestion score are Mumbai (1.00), followed by Kolkata (55.17) and Ulaanbaatar (62.95).
- The cities with the best road quality score are Geneva, Zurich, and Basel (100), while the cities with the lowest score are Lagos (1.00), followed by Bogota (59.31) and Rio de Janeiro (59.70).
- The cities with the best public transport score are New York (100), followed by Singapore (99.86) and Tokyo (98.89), while the cities with the lowest score are Karachi (1.00), followed by Bogota (16.94) and El Paso (60.77).
- The cities with the best city speed sample score are Calgary (100), followed by Glasgow (95.24) and Seattle (94.08), while the cities with the worst score are Mumbai (1.00), followed by London (28.80) and Kolkata (28.99).
- The cities with the highest average car age are Mumbai, Kolkata, and Athens (15.00), while the cities with the lowest average age are Dubai (5.20), Singapore (5.46) and Tokyo (6.00).
“Despite advances in the accessibility of transportation, cars remain the most commonly used mode of transport in the world. Whether running on fuel or electric power, cities will continue to have to make adjustments so that they can accommodate the flow of vehicles,” commented Sébastien Rohart, Managing Director of Mister Auto, which conducted the study. “Our study shows that while many cities already have the infrastructure and legislation in place, there’s still a lot of work to be done towards making driving safe and affordable across the board.”
"There are a number of cities in the world where you can’t even open the window while driving due to the amount of smog and pollution from cars, which make a huge impact on the health and safety of their drivers and inhabitants,” he added. “We included air quality in this study because we wanted to see which cities around the world are tackling the problem of air pollution, while making it safe for their citizens to get from A to B without having to risk their health doing so."

RELATED ARTICLES

Horse Powertrain develops ‘all-in-one’ powertrain for hybridizing BEV platforms
 Ajit Dalvi
 20 Apr 2026
X-Range C15 Direct Drive is an ‘all-in-one’ hybrid powertrain that allows BEV platforms to serve as foundations for HEVs...

Autoliv Plans JV for Advanced Safety Electronics With China’s HSAE
Ajit Dalvi
11 Oct 2025
The new joint venture, which is to be located strategically near Shanghai and close to several existing Autoliv sites in...

JLR to Restart Production Over a Month After September Hacking
Ajit Dalvi
07 Oct 2025
Manufacturing operations at the Tata Group-owned British luxury car and SUV manufacturer were shut down following a cybe...

