


 Follow us
Car and SUV users in Bengaluru and Pune took over 27 minutes to travel 10km in CY2023
Traffic remains a challenge worldwide as life returns to pre-pandemic levels. Four Indian cities are among the 80 cities in the 2023 TomTom Traffic Index study, which found that drivers took more than 20 minutes to complete a 10-kilometre trip.
 06 Feb 2024
 20978 Views
Share -
20978 Views
Share -


The findings of the 2023 TomTom Traffic Index are out and four Indian cities – Bengaluru, Pune, Delhi and Mumbai – are among the 387 cities in 55 countries on six continents surveyed for their traffic trends. The latest and 13th edition of the global study covers metrics such as congestion, average travel time, the impact of rush-hour traffic on vehicle users and the environmental impact. What’s more, it also tracks the cost of driving which, in a world impacted by inflation, is eating into motorists’ income.
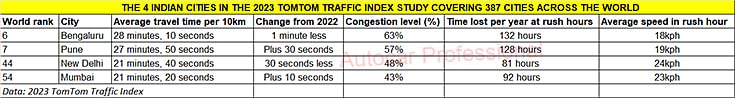 Bengaluru and Pune in the Top 10 cities with the slowest traffic. London tops the list again wth average travel time of 37 minutes, 20 sec for a 10km drive.
Bengaluru and Pune, ranked No. 6 and No. 7 respectively have the dubious distinction to be among the Top 10 cities with the slowest traffic globally. The average travel time for a typical 10km-long-journey in Bengaluru in CY2023 was 28 minutes and 10 seconds, one minute less than it did in CY2022 – if that is of any solace to motorists in that city.
As per the TomTom Traffic Index for 2023, London continues to be the world’s slowest city – average travel time for a 10km drive there was 37 minutes and 20 seconds. That’s a minute more than in 2022 and nearly two minutes more than in 2021, which indicates a gradual return to the pre-Covid-19 trend of consistently increasing traffic. It’s the same in the four Indian cities named in this survey.
Dublin (Ireland), Toronto (Canada), Milan (Italy) and Lima (Peru) are ranked second, third, fourth and fifth respectively, just above Bengaluru and Pune.
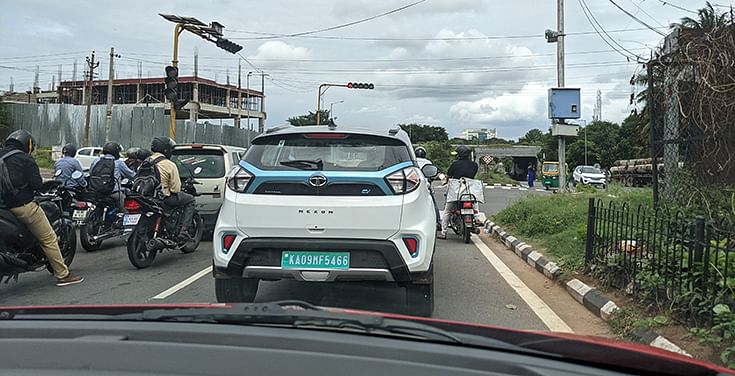 Motorists in Bengaluru rush-hour traffic clocked an average speed of 18kph and lost 132 hours in traffic last year. (Photo: Mayank Dhingra)
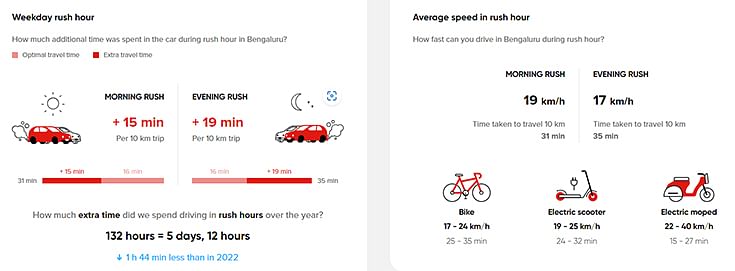 In rush-hour traffic, the Bengaluru motorist clocked an average speed of 18kph and lost 132 hours last year. The study’s data points for Bengaluru were:
- Travel time decreased in Bengaluru last year. The data suggests that average time it took to travel 10 km decreased by 1 minute.
- September 27 (a Wednesday) was the worst day for motorists there because it took 32 minutes and 50 seconds to drive 10km.
Growing traffic congestion in Pune meant that local car users took 27 minutes and 50 seconds – an increase of 30 seconds over 2022 – to travel 10km at an average speed of 19kph in rush-hour, losing 128 hours in the year.
Meanwhile, motorists in New Delhi (ranked No. 44) took 21 minutes and 40 seconds to cover the same distance, clocking 24kph average speed in rush-hour and losing a cumulative 81 hours last year. Compared to 2022, Delhi car users saved 30 seconds on each trip. Compared to 2022, Delhi car users saved 30 seconds on each trip, owing to the rapid improvement in the national capital’s road infrastructure that is now brimming with flyovers, roundabouts, and now tunnels that aim to eliminate long snarls.
New Delhi is also benefiting from other traffic-smoothening initiatives. As part of the Zero Fatality Corridor (ZFC) initiative in New Delhi, the SaveLIFE Foundation tests temporary urban design interventions through Tactical Urbanism Trials. An essential component of these trials is road space redistribution to ensure modal equity, road geometrics modification, traffic channelisation, vehicular speed reduction, and addition of pedestrian and cyclist safety infrastructure.
India’s financial capital Mumbai, which has an estimated vehicle population of 4.5 million units and over 1.3 million privately owned passenger vehicles, remains traffic gridlocked. The slow-traffic scenario is also exacerbated by the major road construction work underway across different parts of the city which is seeing multiple projects being implemented to reduce traffic intensity in the near future.
As per the TomTom survey, of the 198 hours a Mumbai motorist lost in travel during rush-hour last year, 92 hours were lost due to traffic congestion. The key data points for Mumbai are:
- Average travel time increased in Mumbai by 10 seconds
- July 4 was the worst day to travel in Mumbai in 2023 – average travel time for 10km on that day was 26 minutes and 40 seconds.
- 1,004kg of CO2 is emitted by a petrol car during Mumbai rush hours, with 313kg of this due to traffic congestion. That’s the equivalent of 100 trees absorbing that amount of CO2 in a year.
Which cities get traffic right?
Not all cities are affected by traffic as much, though — Japanese cities fare much better, states TomTom. For instance, in Tokyo, a 10km drive in optimal traffic will take about 18-and-a-half minutes. With traffic, that same journey would take 23 minutes and 40 seconds. Here, drivers lose only six minutes to traffic congestion — half what Londoners lose. Interestingly, American cities buck the general trend and, according to the TomTom Traffic Index, manage traffic well. In cities like Dayton and Akron, Ohio, and Albany and Syracuse, New York, drivers lose very little time to traffic. Many other American cities, including Detroit, Memphis, St. Louis, Tulsa, Cincinnati and Buffalo, have lowest travel times.
TomTom’s Traffic Index methodology
According to TomTom, by splitting up all journeys taken into smaller chunks and then reconstructing them into different 10km routes and calculating their travel times, TomTom gains an insight into traffic that more closely represents real-world driving conditions. It also allows driving conditions in different cities to be compared more consistently, as the new method creates a consistent metric to compare by.
The latest Index has ranked the 387 cities based on their average travel time. Additional variables enabled it to measure the financial impact of fuel costs and traffic congestion, as well as the fuel/kWh consumption and CO2 emissions of petrol, diesel, or BEV cars.
With the study’s findings, it is possible “to examine those cities where drivers lose less time to traffic and compare them to those where drivers lose a lot. We can begin to answer questions such as: how can we improve traffic flows? How can we help people make more mindful journeys? How can we reduce emissions? How can we improve last mile deliveries? How can we make cities better for everyone?”
Cost-efficient motoring tips
With volatile fuel prices and a return to pre-lockdown traffic levels, getting around is more costly than ever. TomTom offers four tips (below) to help save both time and money.
Travel at different times: If it’s possible, try and travel outside of rush hour. By leaving earlier or waiting until later, you’ll spend less time idling in queues.
Run errands all at once: Rather than making two or more separate trips throughout the day, try to do everything in a single journey.
Wait with your engine off: Idling burns through fuel – so if you find yourself waiting for at least a minute, it’s worth switching off your engine.
Drive mindfully: Did you know that it’s cost effective to stick to speed limits? In fact, at higher speeds, a 10mph / 16kph increase can use up to 25% more fuel.
RELATED ARTICLES

TVS Motor: The New King of India's Electric 2-Wheeler Market
 Angitha Suresh
11 Feb 2026
Angitha Suresh
11 Feb 2026
January 2026 sees TVS Motor solidify its position with 34,558 units Bajaj struggles to keep pace.

Electric PV Sales Stabilize after GST Hit
 Arunima Pal
11 Feb 2026
Arunima Pal
11 Feb 2026
Fresh FADA data shows January 2026 registrations surging 55% year-on-year, with Tata, JSW MG, and Mahindra all posting s...

Bajaj Chetak production plunges by 47% in July due to shortage of rare earth magnets
 Ajit Dalvi
14 Aug 2025
Ajit Dalvi
14 Aug 2025
Bajaj Auto manufactured 10,824 Chetaks last month, 9,560 fewer units than the 20,384 Chetaks produced in July 2024. As a...

